Sport for Business member Fanaticus Inc has completed a comprehensive analysis of how Irish sports fans engage with technology and digital content.
The first objective of the analysis was to understand how, what and when sports fans consume sports content generally.
The second objective was to understand how and what content sports fans consume specifically during live sports broadcasts.
In conjunction, it was hoped that insights would be garnered as to how current digital content appetites might be unfulfilled during live sports broadcasts.
The outcomes are highly interesting if not entirely unsurprising. Some of the main findings are as follows…
Access
The survey asked respondents where they access most of their sports information. Results show that 51% receive most of their sports information from sports specific websites, followed by subscription based tv services at 15% and radio at 10%.
69.5% use their smartphone to access sports information on a regular basis as opposed to 50% using a laptop and 34% using a tablet. 60% of respondents access sports information more than once per day and another 14% access information at least once every day.
Respondents were asked specific questions in terms of what kinds of sports related content and activities they engage with online. The following is the breakdown of responses…..
| I follow the opinions of others via social media | 59.62% |
| I share my opinions via social media | 37.09% |
| I check statistics / analysis from games / events | 61.03% |
| I watch highlights / incidents from games / events | 71.83% |
| I bet on games / events | 31.92% |
| I play fantasy games | 29.11% |
| None of the above | 9.86% |
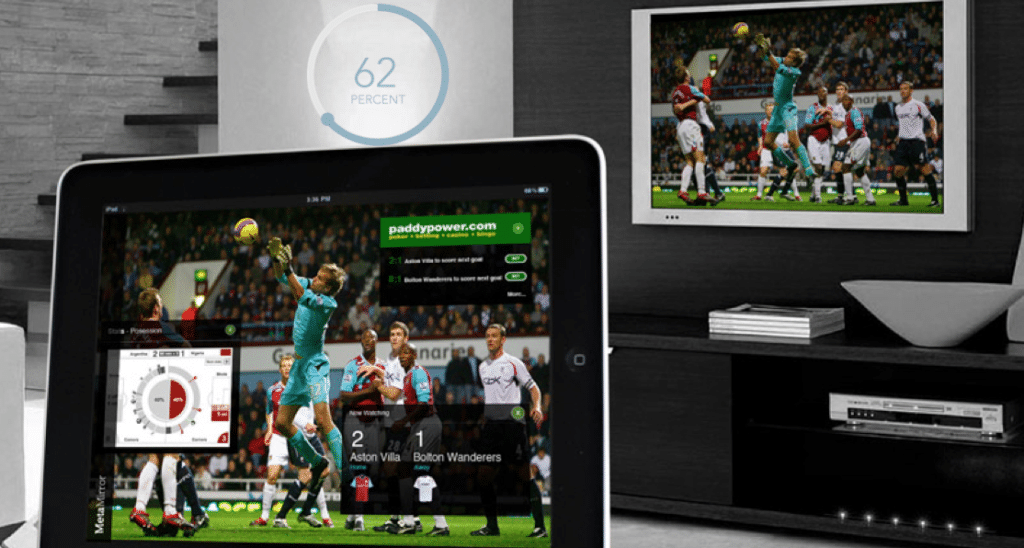
The next question fans were asked was what kinds of sports related content and activities they engage with online specifically during sports broadcasts.
Respondents were questioned regarding the amount of time that they spend concentrating on second screen content during live sports broadcasts. It emerged that 10.25% of those surveyed actually spend 50% or more of their time concentrated on a second screen.
Only 21.26% of people who watch sports broadcasts do not engage in any second screen activity.
Smartphones are the most popular second screening device with 56% of respondents using them either regularly or frequently to access content during broadcasts. This compares to 31% for laptops and 27% for tablets.
Social Media
Perhaps unsurprisingly, the most popular current second screen behaviours are centred around social media. Approaching half of all respondents (44.08%) track the opinions of others on social channels during live sports broadcasts and a third (33.70%) share their own opinions via social media.
Also noteworthy is that there is a significant cohort (26.07% – 27.49%) that tracks live statistics, analytics, highlights and match incidents during live broadcasts.
When comparing these numbers with those in Table 1 however, we can see that this represents only about a third of the fans that track live statistics, analytics, highlights and match incidents outside live broadcasts.
This raises the question as to whether fans prefer to access this content outside game-time or whether appropriate content services simply are not available at present during game-time?
Consequently, the next question was designed to gauge latent unsatisfied demand across content categories and to identify possible future trends. Respondents were asked what would they do online during live broadcasts if better content services were available.
| I would follow the opinions of others via social media | 34.15% |
| I would share my opinions via social media | 21.34% |
| I would check statistics / analysis from games / events | 43.90% |
| I would watch highlights / incidents from games / events | 32.93% |
| I would monitor live betting | 13.41% |
| I would check my progress in fantasy games | 7.32% |
| I would listen to alternative commentary / analysis online | 29.27% |
Instantly, a number of potential trends can be identified. There is a significant level of interest in improved content services in relation to live statistics & analytics, highlights & incidents and also alternative commentaries.
However, if there were improved services available in these categories, based upon the numbers, there would be less social media interaction and fantasy gaming during live broadcasts. As a broad trend this would suggest that sports fans would favour more live information over higher levels of interaction.
Contact us today if you would like a full copy of the report
[contact-form-7 id=”18602″ title=”Fanaticus Report on Second Screen Activity”]